“How do you feel?”
No, really. How do you actually feel?
Identifying our emotions can be one of the most difficult things we do on a regular basis. It’s easy to say we are feeling “good” or “happy”; even saying we’re feeling “stressed” has become normalized. However, how we are truly feeling (and why) is often much more nuanced and complicated. Luckily, various artists, authors and researchers in the field of psychology have created charts and tools to help us out. Here are five charts you may need if you have a hard time identifying your emotions.
Find your people on The Mighty! Review the list of communities or start your own in The Mighty app.
1. The Wheel of Emotions
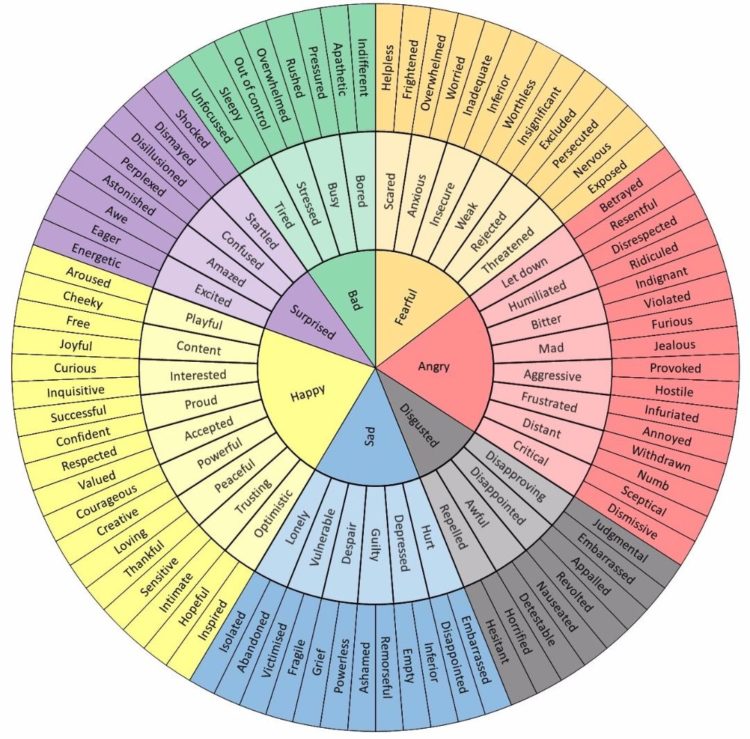
This tool has gained popularity recently, so you may have already seen it, but it is certainly worth including on this list; it is a giant “wheel” of emotions, color-coded by “category” of emotions. As fellow Mighty Contributor and Editorial Director Sarah Schuster describes in her article about this tool:
“…what makes the Wheel of Emotions so great is that it starts out relatively vague, and then moves on to more specific, intense emotions. Even if I think I feel nothing… I can usually at least choose an emotion to start. My options are: Bad, Fearful, Angry, Disgusted, Sad, Happy, Surprised. If I can’t pinpoint exactly how I’m feeling, but know, at the very least, I feel “bad,” I can then move on to the next layer. (Do I feel Bored, Busy, Stressed or Tired?) Then, I can even go one step deeper. If I feel Stressed, do I also feel Overwhelmed or Out of Control? Do I feel both? Even if there isn’t one “perfect” label to sum up how I’m feeling, it sets me in the right direction. It gives me some language to talk about how I feel. It’s better than ‘nothing.'”
2. The Mood Meter
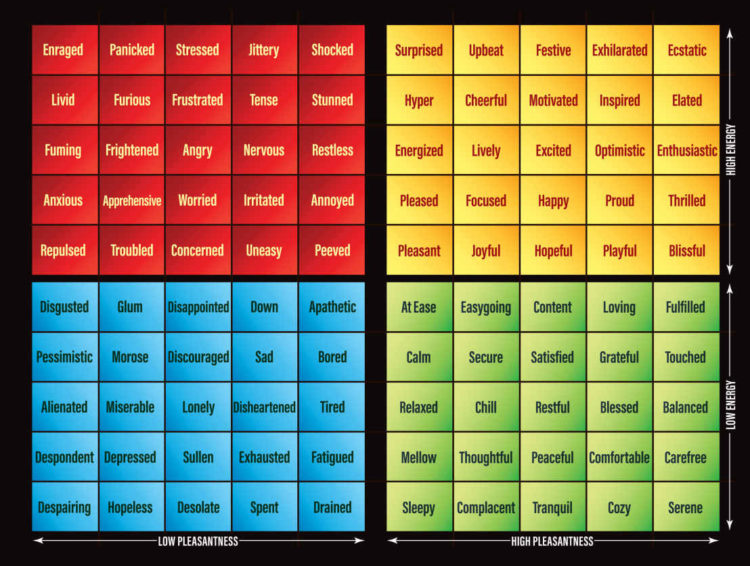
Created by Dr. Marc Brackett, the Mood Meter is another helpful tool for identifying emotions. Brackett is the Founder and Director of the Yale Center for Emotional Intelligence and writes about the importance of being an “emotion scientist” in his book, “Permission to Feel.” The great thing about the Mood Meter is that it separates emotions into four quadrants based on “pleasantness” and “energy” (and much like the Wheel of Emotions, it is also nicely color-coded!) You can identify the emotion that most closely matches your current state and also identify the quadrant: high pleasantness and high energy, high pleasantness and low energy, low pleasantness and high energy, or low pleasantness and low energy.
If this tool is helpful for you, it also comes in the form of an app and can be accessed at moodmeterapp.com.
3. Zones of Regulation
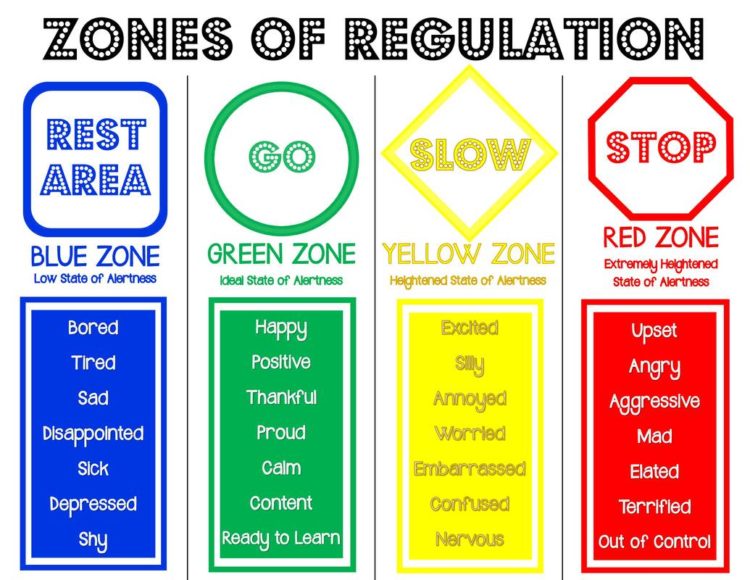
Created by occupational therapist Leah Kuypers, the “Zones of Regulation” can be another powerful tool to use to help one identify and cope with emotions. This tool can be particularly helpful for children and places emotions into four color-coded zones: red, yellow, green and blue. According to Kuypers:
The Red Zone is used to describe extremely heightened states of alertness and intense emotions. A person may be elated or experiencing anger, rage, devastation or terror when in the Red Zone.
The Yellow Zone is also used to describe a heightened state of alertness and elevated emotions, however one has more control when they are in the Yellow Zone. A person may be experiencing stress, frustration, anxiety, excitement, silliness, the wiggles or nervousness when in the Yellow Zone.
The Green Zone is used to describe a calm state of alertness. A person may be described as happy, focused, content, or ready to learn when in the Green Zone. This is the zone where optimal learning occurs.
The Blue Zone is used to describe low states of alertness and down feelings such as when one feels sad, tired, sick or bored.
The Zones can be compared to traffic signs. When given a green light or in the Green Zone, one is “good to go.” A yellow sign means be aware or take caution, which applies to the Yellow Zone. A red light or stop sign means stop, and when one is the Red Zone this often is the case. The Blue Zone can be compared to the rest area signs where one goes to rest or re-energize. All of the zones are natural to experience, but the framework focuses on teaching students how to recognize and manage their Zone based on the environment and its demands and the people around them.”
4. Emotional Equations
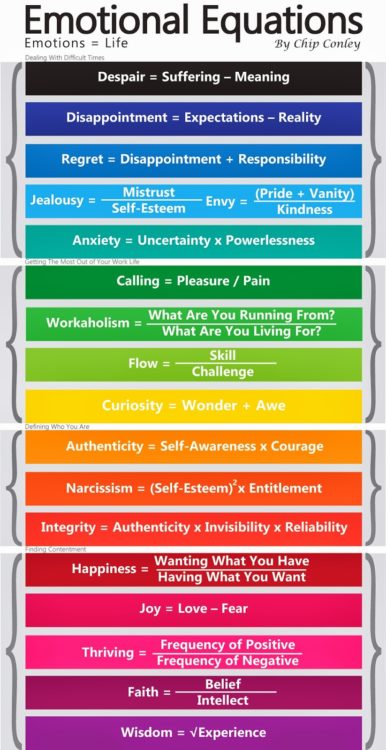
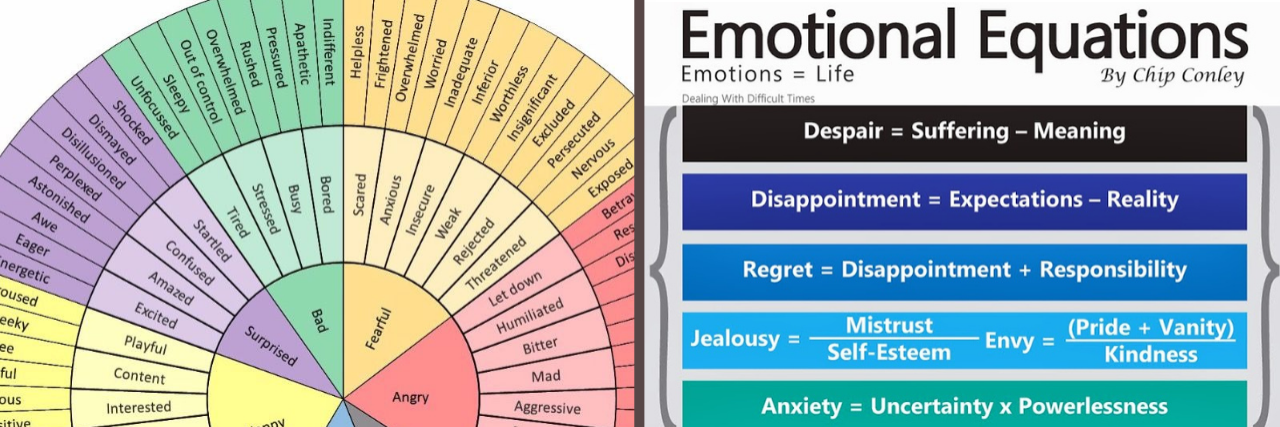
If you have a more scientific/math-oriented brain, this tool might be the one for you! Created by author Chip Conley, this chart looks at emotions as mathematical equations and offers explanations for how certain emotions are formed and created.
In an interview posted on Psychology Today:
“If you believe in Buddhist philosophy and thinking, the first noble truth of Buddhism is that suffering is ever present. So think of suffering as the constant. Think of meaning as the variable. If you remember back to algebra, there is often a constant and a variable in an equation. If suffering remains the constant, then when you increase meaning (the variable) despair goes down.
Despair equals suffering minus meaning. Let me do the simple math so that it makes sense. 8 = 10 – 2. Despair (8) equals suffering (10) minus meaning (2). 8 = 10 – 2. So if meaning goes up from 2 to 3, the despair goes down from 8 to 7. When meaning goes up, despair goes down. This equation helped me to see that meaning and despair are somewhat inversely proportional, so the more I could find meaning in my life, the more I would reduce my despair.”
5. “Feeling Words” Chart
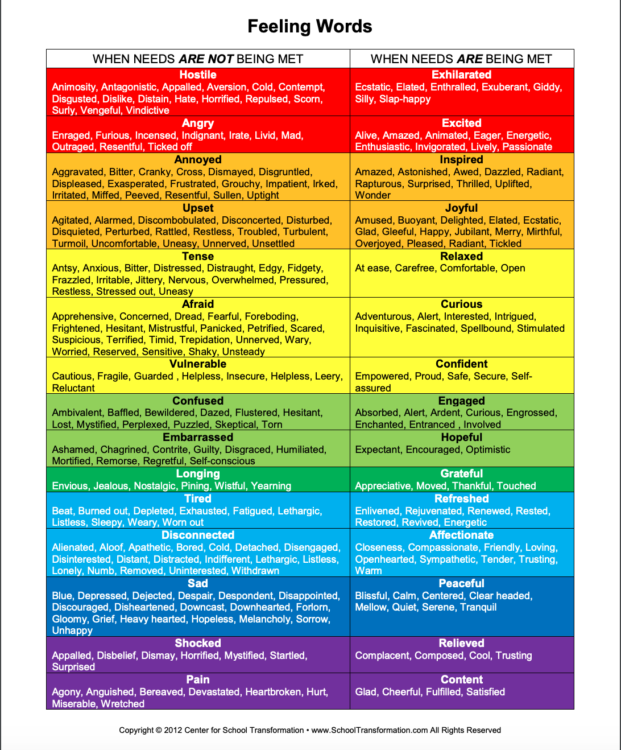
This chart is particularly interesting. It includes two columns of emotions; one column is titled “When Needs Are Not Being Met” and the other column is titled “When Needs Are Being Met.” The columns then list various parallel emotions and other words to describe each emotion. For example, if someone’s needs are being met, they may feel “grateful,” but if their needs are not being met, the parallel emotion is “longing.” This can be a good tool to use if it is helpful for you to identify your emotions based on whether or not your individual needs are met.
If you struggle to identify your emotions, you are not alone. It is, without a doubt, one of the hardest parts of being human. Next time someone asks you how you are feeling, try not to just default to a response of “good,” or “fine”; use one of these charts to describe how you really feel!
Image credits:

